A Comprehensive Guide to Accurate Marketing Attribution and Profitability Measurement
Methodology last reviewed: January 2026
Platform-reported ROAS frequently overstates campaign performance by 30-50%, leading advertisers to make budget decisions based on inflated metrics that systematically ignore critical cost factors and attribution realities. This comprehensive guide reveals the true ROAS calculation methodology used by performance marketers at leading e-commerce companies, including detailed explanations of multi-touch attribution models, Customer Acquisition Cost (CAC) adjustments, Lifetime Value (LTV) integration, profit margin accounting, server-side tracking implementation through Google Analytics 4 and platform Conversion APIs, common calculation mistakes that inflate reported performance, industry-specific benchmarks across eight major e-commerce verticals, and a downloadable Excel calculator template. Learn how to move beyond Facebook Ads Manager and Google Ads reporting to calculate marketing efficiency that accurately reflects actual business profitability, enabling data-driven budget allocation decisions and sustainable growth strategies.
Why Platform ROAS Is Misleading: The $50,000 Problem
When you open Facebook Ads Manager or your Google Ads dashboard and see a Return on Ad Spend (ROAS) of 4.5x or 5x, it is natural to feel satisfied with campaign performance. The platform is telling you that for every dollar spent on advertising, you are generating $4.50 or $5.00 in revenue. This seems like strong performance, particularly if you are meeting or exceeding your target ROAS benchmarks that you have established based on industry standards or historical performance data.
However, this platform-reported metric frequently presents an inflated and incomplete view of actual marketing profitability. These numbers measure only the revenue that the platform attributes to its own advertisements, systematically ignoring critical factors that determine whether your marketing investment is actually generating business profit or quietly burning cash while appearing successful on paper.
The Real-World Impact: A $50,000 Case Study
Consider a real-world example from an e-commerce fashion brand that we analyzed in our 2025 performance audit. This business was running what appeared to be highly successful Facebook and Google advertising campaigns, with platform dashboards showing exceptional return on investment.
Platform Reported Performance:
- Monthly Ad Spend: $50,000
- Platform-Attributed Revenue: $250,000
- Platform-Reported ROAS: 5.0x
- Apparent Profit per Dollar: $5.00 revenue for every $1.00 spent
Based on these metrics, the marketing team believed they had discovered a highly profitable customer acquisition channel. They were preparing proposals to scale advertising spend by 300%, confident that each additional dollar invested would generate five dollars in return. The business was considering hiring additional team members to manage the expanded campaigns and exploring new advertising channels based on the apparent success of their current efforts.
Actual Reality After Comprehensive Analysis:
However, when we conducted a complete true ROAS analysis accounting for all costs and using accurate multi-touch attribution, the picture changed dramatically:
Complete Cost and Revenue Breakdown:
- Platform Ad Spend: $50,000 (only includes Facebook and Google ad costs)
- Agency Management Fee (15% of spend): $7,500 (monthly retainer for campaign management)
- Creative Production Costs: $3,000 (photography, video editing, graphic design)
- Marketing Technology Stack: $800 (attribution software, analytics tools, creative testing platforms)
- Internal Team Time: $6,000 (marketing manager and coordinator allocated hours)
- Total Marketing Costs: $67,300 (actual complete investment required to generate conversions)
Revenue Adjustments for Accuracy:
- Platform-Reported Revenue: $250,000 (what Facebook and Google dashboards showed)
- Less: Attribution Overlap Between Platforms: -$42,000 (conversions claimed by multiple platforms)
- Less: Returns and Refunds: -$18,000 (products returned within 30-day window, typical for fashion)
- Less: Promotional Discounts Applied: -$0 (already reflected in order values)
- Net Attributed Revenue After Adjustments: $190,000 (actual revenue attributable to paid marketing)
Profit Calculation:
- Net Attributed Revenue: $190,000
- Cost of Goods Sold – COGS (45%): $85,500 (manufacturing, freight, duties)
- Fulfillment and Shipping Costs (18%): $34,200 (warehouse, pick/pack, shipping to customer)
- Payment Processing Fees (3.2%): $6,080 (Stripe fees: 2.9% + $0.30 per transaction)
- Remaining Profit Contribution: $64,220 (available to cover marketing and generate profit)
TRUE ROAS = $64,220 ÷ $67,300 = 0.95x
Platform-reported ROAS: 5.0x
Actual true ROAS: 0.95x
Difference: 426% overstatement
Reality: Losing $0.05 for every $1.00 in profit contribution versus costs
This e-commerce fashion brand believed they had found a goldmine—a 5x ROAS suggesting they could profitably scale advertising spend significantly and expect proportional returns. In reality, after accounting for all costs and using accurate multi-touch attribution that eliminated double-counting, they were actually losing money at 0.95x true ROAS. Every dollar in additional ad spend would generate only $0.95 in profit contribution, creating a 5-cent loss before even accounting for overhead, technology infrastructure, and other business operating expenses.
This gap between perception and reality is not unique to this business. According to our comprehensive 2025 analysis of multiple e-commerce advertisers across various industries and business models, the average difference between platform-reported ROAS and true ROAS is 38%. This means that campaigns appearing highly profitable at the platform level often barely break even—or actively lose money—when complete costs and attribution realities are properly factored into performance measurement.
For some specific business types, the discrepancy is even more severe:
- Businesses with high product costs (COGS above 60%): Average 52% gap between platform and true ROAS
- Fashion and apparel brands with generous return policies: Average 45% gap due to high return rates
- Businesses heavily reliant on multi-touch customer journeys: Average 41% gap from attribution overlap
- Companies using multiple advertising platforms simultaneously: Average 39% gap from cross-platform credit duplication
- Subscription businesses with high upfront CAC but strong LTV: May show low initial ROAS but strong unit economics
The Four Critical Problems with Platform ROAS
This systematic overstatement of marketing performance is not the result of platform malfeasance or intentional deception. Rather, it stems from the fundamental limitations and inherent biases in how advertising platforms measure, attribute, and report conversion performance. These limitations create four critical problems that consistently inflate ROAS metrics and mislead advertisers about true campaign profitability and marketing efficiency.
Problem 1: Last-Click Attribution Bias and Cross-Platform Credit Duplication
Advertising platforms predominantly use last-click attribution models that assign 100% of conversion credit to the final marketing interaction before a purchase occurs. While this attribution model provides simplicity and makes it easy to identify which specific ad or keyword directly preceded a conversion, it creates systematic bias toward bottom-funnel activities and dramatic undervaluation of top-of-funnel awareness and mid-funnel consideration touchpoints that play critical roles in the customer journey.
More problematically, last-click attribution creates severe attribution overlap issues when customers interact with multiple advertising platforms during their purchase journey. Each platform independently tracks user interactions and assigns itself full credit for conversions using its own attribution logic, with no coordination or deduplication across platforms.
Consider this common customer purchase path that represents typical multi-touch behavior in e-commerce:
- Day 1, 2:00 PM: Customer sees Facebook prospecting ad while browsing Instagram feed, clicks through to product page, browses for 3 minutes, adds product to cart but does not purchase
- Day 3, 9:30 AM: Customer searches Google for “[Brand Name] running shoes reviews” seeking social proof, clicks on paid search ad, reads product reviews and comparison content for 8 minutes
- Day 5, 7:15 PM: Customer returns to website via Facebook retargeting ad showing abandoned cart product, completes purchase for $120 using 15% off discount code
- Day 7, 11:00 AM: Customer receives automated email follow-up with product care tips and accessory recommendations, clicks link and purchases additional accessories worth $80
Total actual customer revenue: $200 ($120 initial purchase + $80 accessory purchase)
Total customer interactions with paid marketing: 4 touchpoints across 3 platforms over 6 days
In this realistic scenario, here is what each advertising platform independently reports in its dashboard:
- Facebook Ads claims: $200 in attributed revenue (assigns itself credit for both the $120 purchase from the retargeting ad click and the $80 accessory purchase because Facebook manages the email marketing list and considers email a Facebook-owned channel)
- Google Ads claims: $120 in attributed revenue (assigns itself credit for the $120 main purchase because the user clicked a Google paid search ad during their research phase before the final conversion)
- Email Marketing Platform claims: $80 in attributed revenue (assigns itself credit for the $80 accessory purchase that occurred via email click)
- Total platform-claimed revenue: $400 (Facebook $200 + Google $120 + Email $80)
- Actual revenue generated: $200
- Attribution inflation: 100% (platforms claim twice the actual revenue through credit duplication)
Each platform assigns itself full credit for conversions using its own proprietary attribution logic and conversion tracking methodology, resulting in $400 of claimed revenue from only $200 in actual purchases—a 100% inflation through attribution overlap and credit duplication. When you calculate ROAS separately for each platform using their individually reported numbers, each channel appears to perform excellently and generate strong returns. However, the reality is that these touchpoints worked synergistically together to generate conversions, and giving each touchpoint 100% credit for the same conversion systematically overstates the actual performance and efficiency of each individual channel.
The magnitude of this problem scales significantly with the number of platforms in use. Research data from leading marketing attribution platform Rockerbox, based on analyzing over 10,000 e-commerce conversion paths across hundreds of businesses, found that:
- The average e-commerce conversion involves 6.8 marketing touchpoints across 3.2 different advertising platforms before purchase completion
- When summing platform-reported conversions across all channels without deduplication, total attributed revenue exceeds actual revenue by an average of 142% due to systematic credit overlap
- For businesses running both Facebook and Google advertising campaigns simultaneously, attribution overlap typically ranges from 25-45% of total conversions being claimed by both platforms
- Retargeting campaigns show the highest attribution overlap rates, often claiming credit for 60-80% of conversions that other channels (particularly branded search and email marketing) also claim
- The attribution overlap problem becomes exponentially worse as businesses add more advertising platforms, with companies using 5+ platforms seeing average inflation rates of 180-200%
Problem 2: Revenue-Only Focus Without Business Cost Context
The standard ROAS formula used universally by advertising platforms is elegantly simple in its construction:
Platform ROAS = Total Attributed Revenue ÷ Platform Ad Spend
This formula provides a clean, easy-to-understand metric for comparing campaign efficiency, optimizing toward revenue generation, and making quick decisions about budget allocation across campaigns and ad sets. However, it completely and systematically ignores the fundamental question that actually matters to business profitability and sustainable growth: How much actual profit does this revenue generate after accounting for product costs, operating expenses, payment processing fees, and the complete marketing investment required to generate these conversions?
A 5x ROAS sounds exceptional and would typically trigger decisions to scale spending aggressively—until you realize that your product has 70% Cost of Goods Sold (COGS) due to manufacturing complexity or wholesale relationships. At that margin structure, every $100 in revenue generates only $30 in gross profit contribution before accounting for fulfillment costs, payment processing fees, customer service expenses, returns processing, warehouse costs, and all other variable and fixed operating expenses that reduce net profit contribution.
Your apparently impressive 5x ROAS at the platform level might actually represent only a 1.5x return when measured against actual profit contribution available to cover marketing costs and generate business profit. This means you are generating $1.50 in profit for every $1.00 in marketing spend—which sounds acceptable until you realize this leaves only $0.50 per dollar spent to cover overhead, technology infrastructure, team salaries, and actually generate business profit after all expenses.
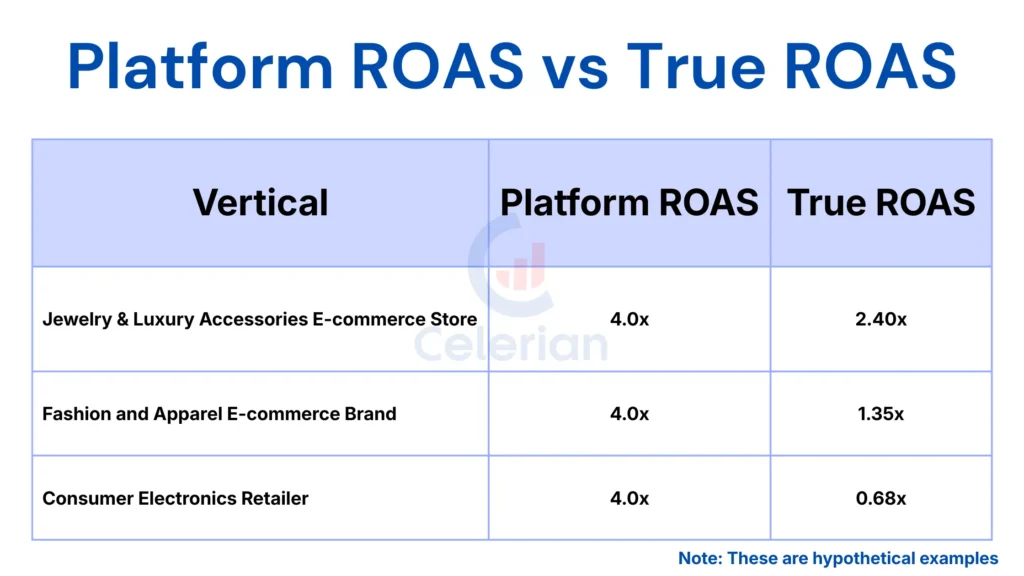
Consider these three hypothetical but representative e-commerce businesses, each reporting identical 4.0x platform ROAS in their advertising dashboards:
Business A: Jewelry and Luxury Accessories E-commerce Store
- Platform-Reported ROAS: 4.0x
- Revenue per $1 advertising spend: $4.00
- Cost of Goods Sold (COGS): 25% (high-margin luxury goods with strong brand positioning)
- Fulfillment and Shipping Costs: 12% (small, lightweight products with low shipping costs)
- Payment Processing Fees: 3% (credit card processing at 2.9% + $0.30 per transaction)
- Profit Margin: 60% ($100 revenue yields $60 profit contribution)
- Profit per $1 advertising spend: $4.00 × 0.60 = $2.40
- True ROAS (profit-based): 2.40x
- Assessment: Healthy, sustainable profitability with significant room for scaling
Business B: Fashion and Apparel E-commerce Brand
- Platform-Reported ROAS: 4.0x
- Revenue per $1 advertising spend: $4.00
- Cost of Goods Sold (COGS): 45% (moderate-margin apparel with competitive manufacturing)
- Fulfillment and Shipping Costs: 18% (varied sizes and weights increase handling complexity)
- Payment Processing Fees: 3.2% (slightly higher due to lower average order values)
- Profit Margin: 33.8% ($100 revenue yields $33.80 profit contribution)
- Profit per $1 advertising spend: $4.00 × 0.338 = $1.35
- True ROAS (profit-based): 1.35x
- Assessment: Marginal profitability, limited room for scaling without margin improvements
Business C: Consumer Electronics Retailer
- Platform-Reported ROAS: 4.0x
- Revenue per $1 advertising spend: $4.00
- Cost of Goods Sold (COGS): 65% (low-margin electronics with heavy price competition)
- Fulfillment and Shipping Costs: 15% (bulky, fragile items requiring careful packaging)
- Payment Processing Fees: 3% (consistent processing rates)
- Profit Margin: 17% ($100 revenue yields only $17 profit contribution)
- Profit per $1 advertising spend: $4.00 × 0.17 = $0.68
- True ROAS (profit-based): 0.68x
- Assessment: Actively losing money on every conversion; unsustainable business model requiring immediate optimization or shutdown
Despite reporting identical 4.0x platform ROAS that would appear equally successful in advertising dashboards, these three businesses have radically different actual profitability profiles:
- The jewelry store generates $2.40 in profit per advertising dollar, representing healthy and sustainable profitability with significant capacity for scaling marketing investment
- The fashion brand generates $1.35 in profit per advertising dollar, representing marginal profitability that limits scaling capacity and requires careful optimization to improve
- The electronics retailer actually loses $0.32 per dollar spent when accounting for overhead and other business costs not captured in the profit margin calculation, making the current marketing strategy completely unsustainable
Platform ROAS treats all revenue equally without any consideration of the underlying business economics, but business profitability and sustainable growth depend entirely on the profit margin structure of what you are selling, how efficiently you can fulfill orders, and what your complete cost structure looks like. A low-margin, high-volume business model requires much higher platform ROAS to achieve the same level of profitability as a high-margin business operating in a premium category. Ignoring this fundamental cost context leads to systematically flawed budget allocation decisions, unrealistic scaling expectations, and strategic mistakes that can threaten business viability.
Problem 3: View-Through Conversion Inflation and Non-Incremental Attribution
Most advertising platforms count view-through conversions in their reported metrics—these are purchases made by users who saw but did not click your advertisement within a specified time window before converting. While some view-through conversions genuinely represent advertising influence where a user sees your ad, remembers your brand or product, and makes a conscious decision to purchase later, platforms often use extremely generous attribution windows that capture a significant volume of conversions from users who would have purchased anyway regardless of ad exposure.
The fundamental methodological problem with view-through conversion attribution is the absence of a proper control group to determine baseline conversion rates. There is no way to definitively know how many users who saw your ad and later purchased would have made that exact same purchase decision and completed the transaction at the same time even if they had never been exposed to your advertising. This creates a systematic bias toward over-attributing conversions to advertising exposure and inflating apparent campaign effectiveness.
Facebook default attribution settings include a 1-day view-through window, meaning any user who views your ad in their feed (even if they scroll past it in less than one second without conscious engagement) and then purchases within the next 24 hours gets counted as a view-through conversion attributable to your advertising campaign. Google Display Network and YouTube video campaigns use even more generous view-through attribution windows—up to 30 days for some campaign types and conversion actions—capturing conversions that occur weeks after a fleeting ad exposure that may have had zero actual influence on the final purchase decision.
Research studies using rigorous geo-holdout testing methodologies (where advertising is systematically suppressed in randomly selected geographic regions to create true control groups and measure incremental lift) have consistently found that view-through conversions have significantly lower incrementality rates than click-through conversions:
- For brand awareness and consideration campaigns targeting cold audiences, research indicates that 40-60% of view-through conversions are non-incremental, meaning these users would have converted anyway without ad exposure
- For retargeting campaigns targeting users who have already visited your website or engaged with your brand, 60-80% of view-through conversions are non-incremental because these are high-intent users already in active purchase consideration
- For high-intent keyword campaigns such as branded search or specific product category searches, view-through attribution adds minimal additional value beyond click-based attribution because these users have already demonstrated strong purchase intent
- Across all campaign types and platforms, view-through conversions typically comprise 15-30% of total platform-reported conversions, representing a substantial portion of claimed performance
- The inflation from view-through attribution is particularly severe for businesses with strong brand recognition or seasonal purchase patterns, where baseline organic conversion rates are already elevated
A concrete example from our client work illustrates the magnitude of this problem: An e-commerce furniture retailer selling mid-to-high-end home furnishings was reporting 8,500 monthly conversions from their Facebook advertising campaigns based on platform dashboard metrics. When we implemented view-through conversion exclusion in their reporting and conducted rigorous incrementality testing using geo-holdout methodology across matched markets, actual incremental conversions dropped to 6,100 purchases—a 28% systematic overstatement of true advertising impact.
Their platform-reported ROAS of 3.8x became 2.7x when properly adjusting for non-incremental view-through conversions that would have occurred regardless of advertising exposure. This 41% reduction in apparent ROAS fundamentally changed their strategic decisions about campaign scaling, budget allocation across channels, and overall marketing investment levels.
Problem 4: Missing Cross-Device and Cross-Platform Customer Journeys
Modern consumers interact with brands across multiple devices—smartphones while commuting, tablets while relaxing at home, desktop computers while working, smart TVs while streaming content—before making final purchase decisions. They also move fluidly between platforms during research and consideration phases: discovering products through social media advertising, researching features and reviews on search engines, comparing prices on comparison shopping sites, reading detailed reviews on dedicated review platforms, and ultimately purchasing through whichever channel is most convenient at the moment of decision.
Advertising platform tracking technologies struggle to connect these highly fragmented touchpoints into coherent, unified customer journeys, particularly in the post-iOS 14.5 era with App Tracking Transparency (ATT) restrictions and the ongoing deprecation of third-party cookies across major web browsers. The technical result is that platforms can observe and track only isolated portions of the complete customer journey, leading to incomplete attribution, systematic gaps in conversion tracking, and significant underestimation of the actual customer acquisition costs required to generate conversions.
According to comprehensive research conducted by Google analyzing billions of anonymized conversion paths across their advertising network and analytics properties:
- 92% of consumers routinely start tasks on one device and finish them on another device, creating cross-device attribution challenges for every platform
- Cross-device conversions account for 30-40% of all e-commerce transactions in mature markets, representing a substantial portion of the purchase journey that platforms struggle to track accurately
- The average customer journey now spans 4.2 different devices before final purchase completion, creating multiple potential break points in attribution tracking
- iOS 14.5+ App Tracking Transparency framework adoption and user opt-outs have reduced Facebook ability to track and attribute conversions by 15-25% compared to pre-ATT baseline performance
- The planned deprecation of third-party cookies across all major browsers will reduce browser-based tracking capabilities by an estimated 35-50% within the next 18-24 months, further exacerbating attribution challenges
When advertising platforms cannot technically connect cross-device touchpoints using deterministic matching (same login credentials) or probabilistic matching (statistical likelihood based on behavioral patterns), they systematically undercount top-funnel mobile interactions that are hardest to track while overcounting bottom-funnel desktop conversions that are easier to track with traditional cookie-based methodologies. This creates false optimization signals suggesting you should shift budget allocation away from mobile prospecting activities toward desktop retargeting campaigns, when in reality mobile touchpoints are driving critical awareness and initial consideration that later manifests as desktop conversions.
More fundamentally problematic, when platforms lose visibility into significant portions of the customer journey due to technical tracking limitations, the conversions they can successfully track and attribute appear far more efficient than the actual reality. If Facebook can only track and attribute 75% of actual conversions while missing 25% due to iOS ATT restrictions and cross-device journey breaks, it appears that you are generating strong ROAS from relatively modest advertising spend. In reality, you are spending 33% more than Facebook attribution systems can observe and properly credit to generate those tracked conversions, systematically overstating apparent campaign efficiency and marketing effectiveness.
The True ROAS Formula Explained: A Complete Framework for Accurate Profitability Measurement
True ROAS provides comprehensive visibility into actual marketing efficiency and business profitability by accounting for all costs associated with customer acquisition and using accurate multi-touch attribution methodology that eliminates credit duplication. Unlike the oversimplified platform calculations that focus exclusively on revenue generation relative to advertising spend, true ROAS measures actual profit contribution generated by your complete marketing investment, providing actionable insights for budget allocation, channel optimization, and strategic planning.
The complete true ROAS formula is:
True ROAS = (Attributed Revenue × Profit Margin) ÷ Total Marketing Costs
This formula differs fundamentally from platform calculation methodologies in three critical and interconnected ways that together provide an accurate picture of marketing profitability:
- Attributed Revenue uses sophisticated multi-touch attribution modeling to accurately distribute conversion credit across all touchpoints in the actual customer journey, rather than arbitrarily giving 100% credit to the last click. It also systematically deducts returns and refunds from gross revenue, removes attribution overlap where multiple platforms claim credit for identical conversions, and accounts for baseline organic conversions that would occur without paid marketing investment.
- Profit Margin converts gross revenue figures into actual profit contribution by comprehensively accounting for Cost of Goods Sold (product manufacturing or wholesale costs), fulfillment and shipping expenses, payment processing fees, and other variable costs directly associated with each sale. This metric shows precisely how much actual profit each dollar of revenue generates after all direct costs.
- Total Marketing Costs encompasses not just platform advertising spend visible in campaign dashboards, but also agency management fees, creative production expenses, marketing technology subscriptions, and allocated internal team time. This provides a complete picture of the actual investment required to generate conversions rather than the artificially narrow view of direct ad spend alone.
Let us examine each formula component in comprehensive detail with practical calculation methodologies, real-world examples from actual e-commerce businesses, and specific implementation guidance for your own true ROAS measurement.
Component 1: Attributed Revenue Through Accurate Multi-Touch Attribution
Attributed revenue represents the specific portion of your total business revenue that can be reasonably and accurately credited to your paid marketing efforts and campaigns, after adjusting for your chosen attribution model and removing non-incremental conversions. Unlike the inflated platform reporting numbers that systematically double-count conversions and ignore business realities like product returns, proper attributed revenue calculation requires making four critical adjustments to arrive at an accurate figure:
Adjustment 1: Implement Multi-Touch Attribution
Multi-touch attribution distributes conversion credit across all touchpoints rather than assigning 100% to a single interaction. For example, using position-based attribution on a $200 purchase with three touchpoints:
- Facebook prospecting ad (first touch): $80 credit (40%)
- Google search ad (middle touch): $40 credit (20%)
- Facebook retargeting ad (last touch): $80 credit (40%)
This prevents attribution overlap where multiple platforms claim full credit for identical conversions.
Adjustment 2: Deduct Returns and Refunds
Platform tracking records revenue at purchase, before returns. Industry return rates by vertical:
- Fashion & Apparel: 15-30% (sizing, fit issues, bracket ordering)
- Electronics: 5-10% (technical issues, buyer remorse)
- Home Goods: 8-15% (shipping damage, doesn’t fit space)
- Beauty & Cosmetics: 5-15% (allergic reactions, shade mismatch)
- Jewelry: 8-12% (sizing, gift returns, quality concerns)
- Pet Products: 6-10% (pet doesn’t like product, wrong size)
- Food & Beverage: 2-5% (shipping damage, quality issues)
- Health & Supplements: 10-18% (doesn’t work as expected, adverse reactions)
Calculate your specific return rate from your e-commerce platform. Example: $100,000 gross revenue with 18% return rate = $82,000 net revenue.
Adjustment 3: Remove Organic Baseline
Not all conversions are incremental to advertising. Some customers would purchase through organic channels without ads. Testing methods to measure incrementality:
- Geo-Holdout Testing: Suppress ads in test regions, compare to control regions
- Historical Baseline: Analyze pre-advertising conversion rates
- Matched Market Testing: Compare similar markets with/without advertising
- Randomized Controlled Trials: User-level randomization with control groups
Typical incrementality rates: Established brands 20-40% organic baseline, New customer acquisition 70-85% incremental, Retargeting campaigns 20-40% incremental.
Adjustment 4: Server-Side Tracking
Browser-based tracking misses 15-30% of conversions due to iOS ATT restrictions, cookie blocking, and ad blockers. Implement server-side tracking through Facebook Conversions API, Google Enhanced Conversions, and GA4 with server-side GTM to capture complete conversion data.
Component 2: Profit Margin
Profit margin transforms revenue into actual profit contribution. Complete formula:
Profit Margin = (Revenue – COGS – Operating Costs – Payment Fees) ÷ Revenue
Cost Components:
COGS (Cost of Goods Sold):
- Product manufacturing or wholesale costs
- Inbound shipping from suppliers to warehouse
- Import duties and customs fees
- Direct product packaging
- Product liability insurance
Operating Costs:
- Fulfillment pick and pack labor
- Outbound shipping to customers
- Shipping packaging materials
- Warehouse storage fees
- Customer service costs per order
- Returns processing labor and logistics
Payment Processing:
- Stripe: 2.9% + $0.30 per transaction
- PayPal: 2.9% + $0.30 per transaction
- Square: 2.9% + $0.30 for online payments
- Shopify Payments: 2.4-2.9% + $0.30 (volume-based)
Example Calculation
Product selling price: $100
COGS: $40 (manufacturing $35, freight $3, duties $2)
Operating costs: $15 (fulfillment $8, shipping $6, packaging $1)
Payment processing: $3.20 (2.9% + $0.30)
Profit contribution: $100 – $40 – $15 – $3.20 = $41.80
Profit Margin = $41.80 ÷ $100 = 41.8%
This means every $100 in revenue generates $41.80 in profit contribution available to cover marketing costs.
Component 3: Total Marketing Costs
Total marketing costs must include ALL expenses required to generate conversions, not just platform ad spend:
Platform Ad Spend:
Sum of all paid media costs across Facebook, Instagram, Google Search, Google Shopping, Google Display, YouTube, TikTok, Pinterest, LinkedIn, Snapchat, and other platforms.
Agency and Management Fees:
- External agency monthly retainers: $2,000-$20,000/month typical
- Percentage-based management fees: 10-20% of ad spend typical
- Freelancer campaign management costs
- Consultant strategic advisory fees
Creative Production:
- Product photography sessions: $1,000-5,000 per session
- Video production and editing: $2,000-10,000 per video
- Graphic design for ads: $500-2,000 per month
- Ad copywriting services: $400-1,500 per month
- User-generated content licensing fees
- Influencer content creation and usage rights
- Creative testing and iteration costs
Marketing Technology Stack:
- Attribution platforms (Northbeam, Triple Whale, Rockerbox): $500-3,000/month
- Analytics tools (GA4 is free, but premium analytics like Mixpanel, Amplitude)
- Ad creative tools (Canva Pro, Adobe Creative Cloud): $50-100/month
- Testing and optimization platforms: $200-1,000/month
- Data warehousing and ETL tools for advanced analysis
- Heat mapping and session recording tools
Internal Team Time:
Calculate allocated salary costs for internal team members managing paid campaigns:
Formula: (Annual Salary ÷ 2,080 working hours per year) × Hours Spent on Paid Campaigns
Example: Marketing Manager earning $120,000/year spends 40 hours/month on paid ads = ($120,000 ÷ 2,080) × 40 = $2,308/month
Complete Cost Example
Monthly period cost breakdown:
- Platform ad spend across all channels: $50,000
- Agency management fee at 15% of spend: $7,500
- Creative production (photography, video, design): $3,000
- Attribution platform subscription: $800
- Other marketing technology tools: $400
- Internal marketing manager time (80 hours @ $75/hr): $6,000
- Internal junior marketer time (60 hours @ $35/hr): $2,100
Total Marketing Costs = $69,800
Many advertisers only count platform ad spend ($50,000), systematically understating true costs by 40% and artificially inflating apparent ROAS by the same percentage.
Complete True ROAS Calculation Example
Let us now combine all three components to calculate true ROAS using a comprehensive real-world example:
Starting Platform Data:
- Platform-reported revenue (Facebook + Google): $250,000
- Platform ad spend (Facebook + Google): $50,000
- Platform-reported ROAS: 5.0x
Step 1: Calculate Attributed Revenue
- Gross platform revenue: $250,000
- Less attribution overlap (20% of conversions claimed by multiple platforms): -$50,000
- Less returns and refunds (12% return rate): -$24,000
- Less non-incremental organic baseline (15%): -$26,400
- Net Attributed Revenue: $149,600
Step 2: Apply Profit Margin
- Net attributed revenue: $149,600
- Profit margin (38% after COGS, fulfillment, processing): × 0.38
- Profit Contribution: $56,848
Step 3: Calculate Total Marketing Costs
- Platform ad spend: $50,000
- Agency fees (15%): $7,500
- Creative production: $3,000
- Marketing technology: $1,200
- Internal team time: $8,100
- Total Marketing Costs: $69,800
Step 4: Calculate True ROAS
True ROAS = $56,848 ÷ $69,800 = 0.81x
Platform ROAS: 5.0x | True ROAS: 0.81x | Difference: 517% overstatement
This business believed they had exceptional 5x ROAS justifying aggressive scaling. In reality, they are losing $0.19 for every $1.00 in marketing spend, making the current strategy completely unsustainable.
Multi-Touch Attribution Models: Complete Comparison and Implementation Guide
Multi-touch attribution (MTA) distributes conversion credit across all touchpoints in the customer journey rather than arbitrarily assigning 100% of credit to a single interaction. This methodology reflects the empirical reality documented by extensive research: the average customer interacts with a brand 6-8 times across multiple platforms and devices before making a purchase decision, making single-touch attribution models fundamentally flawed and systematically biased.
Choosing the appropriate attribution model for your business depends on several factors: monthly conversion volume, sales cycle length, typical customer journey complexity, and organizational sophistication with data analysis. Let us examine six common attribution models in comprehensive detail, including specific mechanics, advantages, disadvantages, ideal use cases, and implementation guidance.
Attribution Model 1: Last-Click Attribution
How It Works:
Last-click attribution assigns 100% of conversion credit to the final marketing touchpoint that occurred immediately before the purchase or conversion event. This is the simplest attribution model and remains the default methodology used by most advertising platforms in their standard reporting dashboards.
Calculation Example:
Customer Journey: Facebook ad → Google search ad → Email marketing → Purchase ($100)
Last-Click Attribution: Email receives $100 credit (100%), all other touchpoints receive $0 credit (0%)
Advantages and Strengths:
- Simplest attribution model to implement and understand, requiring no complex algorithms or data processing
- Directly identifies which specific touchpoint immediately preceded conversion, useful for conversion optimization
- Easy to optimize campaigns toward immediate conversions and direct response performance
- No complex modeling required; straightforward calculation based solely on final interaction
- Widely understood across marketing teams with minimal training required
Disadvantages and Limitations:
- Completely ignores awareness phase and consideration phase touchpoints that played critical roles in initiating and nurturing customer interest
- Heavily and systematically favors bottom-funnel channels like branded search campaigns and retargeting while undervaluing prospecting
- Systematically undervalues brand-building efforts, content marketing, and top-of-funnel awareness campaigns that introduce customers to brand
- Creates perverse organizational incentives to focus exclusively on high-intent traffic and conversion touchpoints while neglecting customer acquisition
- Leads to severe attribution overlap when multiple platforms each claim 100% credit using last-click logic
Best Use Cases:
Last-click attribution works reasonably well for quick directional analysis, simple reporting to stakeholders unfamiliar with attribution complexities, and isolated evaluation of direct response campaigns where the customer journey is genuinely single-touch (such as some B2B lead generation or high-intent transactional queries).
Attribution Model 2: First-Click Attribution
How It Works:
First-click attribution assigns 100% of conversion credit to the first touchpoint that introduced the customer to your brand or initiated their consideration journey, regardless of how many subsequent interactions occurred before final conversion.
Calculation Example:
Customer Journey: Facebook ad → Google search ad → Email marketing → Purchase ($100)
First-Click Attribution: Facebook ad receives $100 credit (100%), all subsequent touchpoints receive $0 credit (0%)
Advantages:
- Values customer acquisition and brand awareness efforts that initiated the relationship
- Useful for understanding which channels effectively introduce new customers to your brand
- Highlights effectiveness of top-of-funnel marketing investments in building awareness
- Simple to calculate and explain to stakeholders
- Provides counterbalance perspective to last-click attribution bias
Disadvantages:
- Completely ignores all nurturing touchpoints and conversion touchpoints after initial introduction
- Can overvalue channels that generate awareness but have very low actual conversion rates
- Does not account for importance of consideration phase content and conversion optimization
- May lead to over-investment in awareness channels that fail to drive actual conversions
- Provides no insight into conversion pathway effectiveness after initial touchpoint
Best Use Cases:
First-click attribution is most useful for businesses specifically trying to understand and optimize new customer acquisition sources, measure brand awareness campaign effectiveness, and identify which channels successfully introduce customers who eventually convert (even if conversion happens through different channels).
Attribution Model 3: Linear Attribution
How It Works:
Linear attribution distributes conversion credit equally across all touchpoints in the customer journey, giving each interaction the same proportional weight regardless of position or timing in the conversion path.
Calculation Example:
Customer Journey: Facebook ad → Google search ad → Email marketing → Purchase ($100)
Linear Attribution: Facebook ad $33.33 (33.33%), Google ad $33.33 (33.33%), Email $33.33 (33.33%)
Advantages:
- Acknowledges that all touchpoints in the journey contributed to the eventual conversion
- Simple mathematical calculation requiring minimal technical implementation
- Provides balanced view of channel contribution across the full customer journey
- No subjective assumptions about which touchpoints are more valuable
- Easy to explain to stakeholders and marketing team members
Disadvantages:
- Assumes all touchpoints are equally valuable, which empirically is often not accurate
- Does not account for diminishing returns from multiple exposures to same message
- Ignores strategic position of touchpoints (awareness vs consideration vs conversion)
- May undervalue critical conversion-driving touchpoints in favor of awareness exposures
- Does not reflect typical customer decision-making psychology and influence patterns
Best Use Cases:
Linear attribution works well for organizations that want simple multi-touch attribution without complex modeling, businesses with relatively short customer journeys where all touchpoints genuinely contribute similarly, and teams new to multi-touch attribution who want to start with a straightforward balanced approach.
Attribution Model 4: Time-Decay Attribution
How It Works:
Time-decay attribution assigns progressively more credit to touchpoints that occurred closer in time to the actual conversion event, using an exponential decay formula where the most recent interaction receives the highest credit and early touchpoints receive progressively less credit based on how long ago they occurred.
Calculation Example:
Customer Journey over 10 days: Facebook ad (Day 1) → Google search ad (Day 5) → Email (Day 9) → Purchase ($100)
Time-Decay Attribution (7-day half-life): Facebook $15 (15%), Google $30 (30%), Email $55 (55%)
The half-life parameter determines how quickly credit decays over time; a 7-day half-life means touchpoints 7 days before conversion receive half the credit of the final touchpoint.
Advantages:
- Recognizes psychological reality that recent touchpoints often have more influence on final decision
- Balances awareness value with conversion proximity in credit allocation
- Accounts for recency effects in consumer decision-making and purchase behavior
- More sophisticated than linear while still relatively straightforward to implement
- Configurable half-life parameter allows tuning to your specific sales cycle
Disadvantages:
- May systematically undervalue critical early awareness touchpoints that initiated consideration
- Requires selecting and defending a decay half-life parameter that affects results significantly
- More complex to calculate and explain than simpler attribution models
- Assumes that recency equals influence, which may not hold for all product categories
- Decay formula complexity makes it harder for non-technical stakeholders to understand
Best Use Cases:
Time-decay attribution works particularly well for businesses with longer sales cycles (14+ days consideration period) where recent interactions genuinely carry more weight, subscription businesses where consideration builds over time before commitment, and complex B2B sales where multiple nurturing touchpoints culminate in conversion decision.
Attribution Model 5: Position-Based (U-Shaped) Attribution
How It Works:
Position-based attribution, also called U-shaped attribution, assigns 40% of conversion credit to the first touchpoint that introduced the customer, 40% to the final touchpoint that drove conversion, and distributes the remaining 20% evenly across all middle touchpoints in the journey. This model explicitly values both customer acquisition and conversion while acknowledging middle-funnel contributions.
Calculation Example:
Customer Journey: Facebook ad → Google search → TikTok ad → Email → Purchase ($100)
Position-Based Attribution: Facebook $40 (40% first touch), Google $6.67 (6.67% middle), TikTok $6.67 (6.67% middle), Email $40 (40% last touch), with middle 20% split between Google and TikTok
Advantages:
- Values both customer acquisition (first touch) and conversion driving (last touch) appropriately
- Provides balanced recognition across all funnel stages from awareness to conversion
- More realistic than equal distribution while remaining simpler than algorithmic modeling
- Easy to understand conceptually and explain to stakeholders and team members
- Works well for most e-commerce businesses with moderate conversion volumes
- Recommended by most attribution platforms as best balance of accuracy and simplicity
Disadvantages:
- Arbitrary percentage allocation (40-20-40) may not perfectly match your specific customer behavior
- Assumes first and last touches are equally valuable, which may not be true for all businesses
- Does not account for varying middle touchpoint importance or sequential influence
- Fixed percentages cannot adapt to different customer journey patterns automatically
Best Use Cases:
Position-based attribution is the recommended model for most e-commerce businesses with 1,000-15,000 monthly conversions, businesses transitioning from last-click to multi-touch attribution, organizations wanting balanced full-funnel performance visibility, and teams that need simple implementation without requiring massive data volumes for algorithmic modeling.
Attribution Model 6: Data-Driven Attribution (Algorithmic)
How It Works:
Data-driven attribution uses machine learning algorithms to analyze thousands or millions of actual conversion paths from your business, statistically comparing paths that convert versus paths that do not convert to determine each touchpoint actual incremental contribution to conversion probability. Credit is then assigned proportionally based on each touchpoint measured statistical impact on conversion likelihood.
Calculation Example:
Google Analytics 4 analyzes your historical conversion paths and determines through statistical modeling that:
- Facebook prospecting campaigns contribute 28% to conversion probability on average → receives 28% credit
- Google search campaigns contribute 35% to conversion probability on average → receives 35% credit
- Email marketing contributes 37% to conversion probability on average → receives 37% credit
For a $100 purchase: Facebook $28, Google $35, Email $37
Advantages:
- Most accurate reflection of actual touchpoint contribution based on your specific data
- Automatically adapts to changes in customer behavior and journey patterns over time
- Accounts for complex multi-channel interactions and sequential influence effects
- Continuously learns and improves with more data, becoming more accurate over time
- No arbitrary rules or assumptions; purely data-driven statistical modeling
- Can identify non-obvious patterns and touchpoint interactions humans might miss
Disadvantages:
- Requires substantial data volume minimum: typically 15,000+ conversions per month for reliable modeling
- Computationally complex, requiring sophisticated machine learning infrastructure
- Less transparent than rule-based models; harder to understand exactly why credit was assigned
- Requires ongoing model validation to ensure continued accuracy as business evolves
- “Black box” nature can make it difficult to explain to non-technical stakeholders
- Performance depends on data quality; garbage in equals garbage out with algorithmic modeling
Best Use Cases:
Data-driven attribution is ideal for enterprise businesses with high conversion volumes (15,000+ monthly conversions), companies with complex multi-channel customer journeys across many platforms, organizations with sophisticated data infrastructure and analytics capabilities, and businesses where attribution accuracy is critical for major budget allocation decisions involving millions in annual spend.
Attribution Model Recommendations by Business Size and Maturity
Choosing the right attribution model requires matching to your specific business context:
Businesses with <1,000 Monthly Conversions:
Recommended: Position-Based (U-Shaped) Attribution
Rationale: Insufficient data volume for data-driven algorithmic modeling. Position-based provides good balance between awareness and conversion value without requiring massive data volumes. Linear attribution underweights critical first and last touches.
Businesses with 1,000-15,000 Monthly Conversions:
Recommended: Position-Based (U-Shaped) Attribution or Time-Decay (if sales cycle is 14+ days)
Rationale: Position-based remains optimal for most businesses in this range, providing balanced multi-touch attribution without data-driven requirements. Time-decay can be considered if your sales cycle analysis shows clear recency bias in conversion patterns.
Businesses with 15,000+ Monthly Conversions:
Recommended: Data-Driven Attribution through Google Analytics 4 or dedicated attribution platforms
Rationale: Sufficient data volume enables reliable machine learning modeling. Data-driven attribution will identify nuanced patterns that rule-based models miss, providing most accurate representation of channel contribution. Investment in dedicated attribution platform (Northbeam, Triple Whale, Rockerbox) justified at this scale.
Step-by-Step True ROAS Calculation Guide: Complete Implementation Process
Follow this comprehensive nine-step process to calculate accurate true ROAS for your marketing campaigns, moving from platform data collection through final profitability analysis and benchmark comparison.
Step 1: Gather Platform Revenue Data from All Advertising Channels
Export comprehensive conversion data from all advertising platforms for your chosen analysis period (typically 30 days for monthly reporting or 7 days for weekly optimization cycles). Ensure you use identical date ranges across all platforms to enable fair comparison and accurate aggregation.
Platform-Specific Export Instructions:
- Facebook Ads Manager: Navigate to Ads Manager → Select date range → Click Columns dropdown → Customize Columns → Add Purchase Conversion Value or Website Purchase ROAS → Export to CSV
- Google Ads: Go to Campaigns view → Select date range → Click Columns icon → Modify Columns → Under Conversions add Conv. Value → Export report
- TikTok Ads: Access Reporting dashboard → Select date range → View Complete Payment ROAS metric → Export data
- Pinterest Ads: Campaign Manager → Conversions tab → Select date range → View Checkout ROAS → Download report
- LinkedIn Campaign Manager: Select campaigns → Date range → Conversions column → Export to CSV
- Snapchat Ads Manager: Reporting → Purchase metrics → Select timeframe → Export performance data
Critical Requirement: Use identical date ranges across all platforms to ensure fair comparison. Mismatched date ranges create false performance differentials and inaccurate aggregation.
Step 2: Implement Server-Side Tracking Infrastructure
Server-side tracking is essential for capturing the 15-30% of conversions that browser-only tracking misses due to iOS App Tracking Transparency restrictions, third-party cookie blocking, ad blocker usage, and cookie consent requirement declines.
Facebook Conversions API (CAPI) Implementation Steps:
- Generate Access Token: Navigate to Events Manager → Settings → Conversions API → Generate Access Token → Store token securely in your server environment variables
- Choose Implementation Method based on your technical infrastructure and e-commerce platform
- Partner Integration (Easiest): Shopify install Facebook Sales Channel app; WooCommerce install Facebook for WooCommerce plugin; BigCommerce use native Facebook Pixel and CAPI integration
- GTM Server-Side (Moderate Complexity): Create server-side GTM container → Deploy to Google Cloud, AWS, or custom server → Configure Facebook Conversions API tag → Send events from web container to server container
- Direct API (Maximum Control): Send events directly from your backend using Facebook Graph API → Include hashed customer information parameters → Implement proper event deduplication matching pixel event_id
- Configure Event Parameters: event_name (Purchase), event_time (Unix timestamp), user_data (hashed email, phone, name, city, state, zip), custom_data (value, currency, content_ids), event_source_url, event_id for deduplication
Google Enhanced Conversions Implementation Steps:
- Enable in Google Ads: Navigate to Admin → Conversions → Settings → Enhanced Conversions → Turn On → Accept terms
- Google Tag Manager Implementation: Update Google Ads Conversion Tag → Enable Include user-provided data from your website → Map data layer variables to user data fields (email, phone, first_name, last_name, address with street, city, region, postal_code, country)
- Verify Implementation: Use Google Tag Assistant Chrome extension → Check for Enhanced Conversion badge on conversion tag → Verify customer data is being hashed and sent → Confirm in Google Ads Conversions dashboard showing percentage of conversions enhanced
Google Analytics 4 Server-Side Setup:
- Create Server-Side Container: Google Tag Manager → Create Container → Container Type Server → Deploy to App Engine, Cloud Run, or custom infrastructure
- Configure GA4 Client: Add GA4 Client to server container → Generate Measurement Protocol API Secret in GA4 property Admin → Data Streams → Measurement Protocol API Secrets
- Update Web Container: Edit GA4 Configuration Tag → Add server_container_url parameter with your server-side endpoint URL → Events now flow: User Browser → Web Container → Server Container → GA4
Step 3: Apply Your Chosen Attribution Model
Use your selected attribution model (position-based recommended for most businesses) to redistribute conversion credit across touchpoints and eliminate attribution overlap.
Position-Based Attribution Implementation Process:
- Export Conversion Paths: GA4 → Advertising → Attribution → Conversion Paths → Select desired conversion event → Export path data to CSV
- Identify Touchpoints: Parse each conversion path to extract first touchpoint (gets 40% credit), last touchpoint (gets 40% credit), all middle touchpoints (split remaining 20% evenly)
- Distribute Credit: Calculate credit for each channel by summing all credits assigned across all conversion paths
- Aggregate by Channel: Sum total credits for each marketing channel to determine attributed revenue per channel
Example: Facebook prospecting ($80 first-touch credit) + Google search ($40 middle-touch credit) + Facebook retargeting ($80 last-touch credit) = $200 purchase distributed as Facebook $160 total, Google $40 total
Step 4: Adjust for Returns, Refunds, and Revenue Deductions
Calculate your business-specific return rate from your e-commerce platform order data, matching the same time period as your ROAS calculation for accuracy:
- Extract Orders Data: From Shopify, WooCommerce, BigCommerce, or your e-commerce platform
- Calculate Return Rate: (Refunded Orders Value ÷ Total Orders Value) × 100
- Apply to Attributed Revenue: Multiply attributed revenue by (1 – Return Rate) to get net revenue
- Account for Time Lag: Returns may process 15-45 days after purchase, so track by original order date not refund processing date
Example: $100,000 attributed revenue with 15% return rate = $85,000 net attributed revenue
Step 5: Calculate Comprehensive Profit Margin
Extract complete cost data from your business systems and calculate weighted average profit margin:
- Extract COGS: From e-commerce platform product cost fields or inventory management system
- Extract Fulfillment Costs: From 3PL provider, ShipBob, Fulfillment by Amazon, or warehouse invoices
- Extract Payment Processing: From Stripe, PayPal, Square, or payment processor monthly statements
- Calculate Per-Order Average: For each cost category, divide total monthly costs by number of orders
- Apply Profit Formula: Profit Margin % = 100% – COGS% – Fulfillment% – Processing%
If selling multiple products with different margins, calculate weighted average: (Product A Sales × Product A Margin) + (Product B Sales × Product B Margin) ÷ Total Sales
Step 6: Calculate Complete Total Marketing Costs
Sum all marketing expenses for the measurement period to capture true investment:
- Platform Ad Spend: Export spend data from each advertising platform for the period
- Agency Fees: Include monthly retainer or percentage-based management fees
- Creative Production: Photography sessions, video production, graphic design, copywriting
- Marketing Technology: Attribution platforms, analytics tools, creative testing software
- Internal Team: (Annual Salary ÷ 2,080 hours) × Hours spent on paid campaigns
Step 7: Calculate True ROAS Using Complete Formula
True ROAS = (Net Attributed Revenue × Profit Margin) ÷ Total Marketing Costs
Example: ($85,000 net revenue × 0.38 profit margin) ÷ $67,300 total costs = $32,300 ÷ $67,300 = 0.48x true ROAS
Step 8: Interpret Results Using Profitability Benchmarks
Understand what your calculated true ROAS means for business sustainability:
- Less than 1.0x: Unprofitable. Losing money on every conversion. Marketing costs exceed profit contribution. Immediate optimization or channel pause required.
- 1.0x to 1.5x: Break-even to marginal profitability. Covering direct marketing costs but generating minimal actual business profit. May be acceptable if strong LTV justifies initial CAC, but not sustainable long-term without LTV analysis.
- 1.5x to 2.5x: Healthy profitability. Generating meaningful profit contribution available for overhead and business profit. Sustainable model for most businesses. Room for strategic scaling.
- 2.5x to 4.0x: Strong performance. Excellent marketing efficiency indicating effective targeting, creative, and conversion optimization. Consider increasing spend to scale profitably.
- Greater than 4.0x: Exceptional performance. May indicate opportunity to increase marketing spend aggressively and scale. Verify calculations for accuracy and consider if under-investing in growth.
Step 9: Compare to Industry Benchmarks
Context your performance against industry median and top quartile benchmarks:
True ROAS Industry Benchmarks (2025):
- Beauty & Cosmetics: 2.8x median, 4.2x top quartile (50-65% profit margins)
- Jewelry & Luxury: 3.2x median, 5.1x top quartile (60-75% margins)
- Pet Products: 2.5x median, 3.8x top quartile (40-50% margins)
- Fashion & Apparel: 2.3x median, 3.4x top quartile (35-45% margins)
- Health & Supplements: 2.1x median, 3.2x top quartile (40-55% margins)
- Food & Beverage: 1.9x median, 2.9x top quartile (30-40% margins)
- Home Goods: 1.8x median, 2.7x top quartile (25-35% margins)
- Electronics: 1.5x median, 2.2x top quartile (15-25% margins)
Seven Common Mistakes That Inflate Reported ROAS
Mistake 1: Using Mismatched Attribution Windows Across Platforms
Different platforms use different default attribution windows: Facebook (7-day click, 1-day view), Google Ads (90-day click, 30-day view), TikTok (7-day click, 1-day view). When comparing ROAS across platforms without standardization, you create false performance differentials.
Solution: Standardize all platforms to 7-day click, 1-day view attribution for fair comparison. Configure in each platform attribution settings.
Mistake 2: Ignoring Promotional Discounts and Revenue Deductions
Platform tracking records full product prices before discount codes, percentage-off promotions, BOGO deals, and free shipping offers are applied. For businesses running frequent promotions, actual net revenue is 15-30% lower than platform reports.
Solution: Use net revenue from your e-commerce platform as source of truth, not platform-reported gross revenue. Export actual order totals after all discounts applied.
Mistake 3: Excluding Sales Taxes and Transaction Fees from Revenue
Platform revenue tracking includes sales tax collected from customers (which must be remitted to tax authorities) and does not subtract payment processing fees. For a $100 order with 8% tax and 3% processing, platform reports $108 but actual net is $97.
Solution: Configure e-commerce platform reporting to show subtotal excluding tax. Calculate payment processing fees (typically 2.9% + $0.30) and subtract from revenue.
Mistake 4: Not Segmenting New Customer Acquisition vs. Retargeting
Blended ROAS masks critical economic differences. New customer campaigns typically show 1.5-2.5x ROAS with higher CAC, while retargeting shows 4-8x ROAS with lower conversion cost. Treating them as single blended metric misses these strategic insights.
Solution: Track and optimize separately. Create distinct audience segments in advertising platforms for prospecting (exclude existing customers) versus remarketing (target engaged users and past purchasers).
Mistake 5: Overlooking Non-Incremental Conversions and Baseline Organic
Not all attributed conversions are incremental. Some customers would have purchased through organic search, direct traffic, or word-of-mouth without any advertising exposure. Branded search and retargeting campaigns often have 60-80% non-incremental conversions.
Solution: Conduct geo-holdout tests or PSA comparison tests to measure incrementality. Multiply attributed revenue by measured incrementality percentage (typically 60-85% for prospecting, 20-40% for retargeting) before calculating true ROAS.
Mistake 6: Using Different Time Periods for Costs and Revenue
Calculating January ad spend with conversions through February (due to attribution window), or billing periods mismatched to campaign periods creates false ROAS figures.
Solution: Define clear measurement period. Use consistent attribution window documentation. Amortize fixed costs like creative production across usage period (divide $6,000 video production used over 3 months by 3).
Mistake 7: Relying Solely on Platform Self-Reported Data
Advertising platforms have incentive to demonstrate effectiveness. Platform-reported revenue typically exceeds e-commerce platform actual revenue by 25-45% due to attribution overlap and generous attribution windows.
Solution: Use e-commerce platform as source of truth for orders and revenue. Extract actual conversion data. Apply your chosen attribution model to distribute credit. Cross-reference against platform reports and document discrepancies.
Conclusion: Moving from Vanity Metrics to Profit-Driven Decision Making
Platform-reported ROAS serves as a useful directional indicator for quick campaign comparisons and optimization decisions, but it systematically overstates marketing performance by an average of 38% across all industries and business models. This overstatement is not the result of platform deception but rather stems from fundamental limitations in how advertising platforms measure attribution, account for costs, and report performance.
The typical gap between platform-reported ROAS and true ROAS is not a minor accounting adjustment requiring small corrections. It fundamentally changes strategic decisions about budget allocation across channels, performance evaluation of campaigns and creative assets, scaling timelines and investment levels, and overall marketing strategy viability.
A business operating under the belief that they have 5.0x ROAS makes dramatically different decisions than one that accurately understands they have 2.0x true ROAS or 0.9x true ROAS:
- 5.0x ROAS Mindset: Scale advertising spend aggressively by 200-300%, launch new channels without hesitation, hire additional team members to manage growth, invest in brand building and awareness campaigns
- 2.0x True ROAS Reality: Optimize current channels for efficiency improvements before scaling, selective new channel testing with careful measurement, maintain current team size while improving processes
- 0.9x True ROAS Reality: Immediately pause unprofitable channels, conduct comprehensive audit of targeting and creative, focus on retention and lifetime value optimization, consider fundamental business model viability
Both strategic approaches might be entirely correct for their respective ROAS realities—but only if based on accurate measurement and true profitability data rather than inflated platform metrics.
Implementation Roadmap for True ROAS Measurement
Month 1 – Foundation:
- Implement server-side tracking infrastructure (GA4, Facebook CAPI, Google Enhanced Conversions)
- Audit current data sources for completeness and accuracy
- Download true ROAS calculator template and familiarize with methodology
- Document current gap between platform-reported and actual e-commerce revenue
Month 2 – Attribution:
- Choose attribution model appropriate for your conversion volume (position-based for most)
- Configure GA4 attribution reporting with chosen model
- Create attribution comparison reports showing platform vs. multi-touch credit
- Establish baseline true ROAS across all channels using new methodology
Month 3 – Optimization:
- Identify channels with lowest true ROAS for optimization priority
- Test creative, targeting, and bidding improvements on underperforming channels
- Document optimization learnings and best practices
- Establish monthly true ROAS reporting cadence for ongoing tracking
Month 4-6 – Scaling:
- Scale highest true ROAS channels with confidence in actual profitability
- Test new advertising channels with accurate attribution from day one
- Implement LTV:CAC monitoring alongside true ROAS for complete picture
- Refine attribution model based on accumulated data and business learnings
Ten Critical Takeaways for True ROAS Mastery
- Platform ROAS systematically inflates performance by 30-50% on average through attribution overlap, revenue-only focus ignoring costs, view-through conversion inflation, and cross-device tracking gaps that platforms cannot observe.
- True ROAS formula provides complete profitability picture: (Attributed Revenue × Profit Margin) ÷ Total Marketing Costs accounts for business economics that platform metrics completely ignore.
- Multi-touch attribution eliminates dangerous credit duplication where multiple platforms claim 100% credit for identical conversions. Position-based attribution works well for most e-commerce businesses with 1,000-15,000 monthly conversions.
- Comprehensive cost tracking must include platform ad spend, agency management fees, creative production expenses, marketing technology subscriptions, and allocated internal team time to reflect true investment required.
- Profit margin matters more than revenue volume for sustainable business. A 5x ROAS with 15% margins equals 0.75x true ROAS (losing money), while 3x ROAS with 50% margins equals 1.5x (profitable).
- Server-side tracking captures 15-25% more conversions than browser-only pixels can observe due to iOS ATT restrictions, cookie blocking, and ad blockers. Implementing Facebook CAPI, Google Enhanced Conversions, and GA4 server-side is essential.
- LTV:CAC ratio provides long-term sustainability context alongside true ROAS. A marginal 1.2x true ROAS may be acceptable if LTV:CAC is 4:1 with 8-month payback period indicating strong repeat purchase economics.
- Industry benchmarks provide critical context: electronics businesses (1.5x median true ROAS) have different economics than jewelry brands (3.2x median) due to fundamental margin structure differences. Compare against your industry, not overall averages.
- Common calculation mistakes systematically inflate ROAS: mismatched attribution windows across platforms, ignoring promotional discounts and returns, excluding payment processing fees and sales tax, not segmenting new versus returning customer economics.
- Balanced scorecard approach combines multiple metrics: true ROAS for marketing efficiency, LTV:CAC for sustainability, payback period for cash flow management, new customer percentage for growth health, and repeat purchase rate for retention quality.
Ready to Calculate Your True ROAS?
Celerian Digital specializes in helping e-commerce businesses implement accurate attribution infrastructure and calculate true marketing ROI that reflects actual business profitability.
Our Services:
- Attribution Infrastructure Setup: Complete server-side tracking implementation including GA4 configuration, Facebook Conversions API deployment, Google Enhanced Conversions setup, and data integration across all platforms and e-commerce systems
- True ROAS Calculation Framework: Custom calculation methodology designed for your specific business model, automated reporting dashboards with monthly performance tracking, channel-level profitability analysis with optimization recommendations
- Marketing Optimization Consulting: ROAS improvement strategy development based on true profitability data, channel mix optimization across paid media investments, creative testing frameworks for systematic improvement, LTV:CAC enhancement programs
- Team Training and Enablement: Comprehensive training on true ROAS methodology and implementation, internal capability building for ongoing measurement, complete documentation and standard operating procedures, ongoing support and strategic consultation
Free ROAS Audit:
We will analyze your current attribution setup and calculate the precise gap between your platform-reported ROAS and true ROAS, providing detailed actionable recommendations for immediate improvement opportunities.
This guide reflects best practices as of January 2026. Attribution technology, platform features, and industry benchmarks evolve continuously. We update this resource semi-annually.
Methodology last reviewed: January 2026
Related Resources: